Infographics is the study and practice of making visual representations of data, typically very large sets of data.
Infographics are great to expose trends by showing the overall meta patterns in events, or to make single information points easily visible and understandable. The actual visual display of this data is the most interesting thanks to this digital world. This new source of inspiring information can be a quick entry point to a very wide audience.
The key is for Infographic design and representation is deeply rooted in the context of the data and the desired message.
The beauty and art of an Infographic is that unlike text and numbers, images don’t need explanations or translations. They are the message.
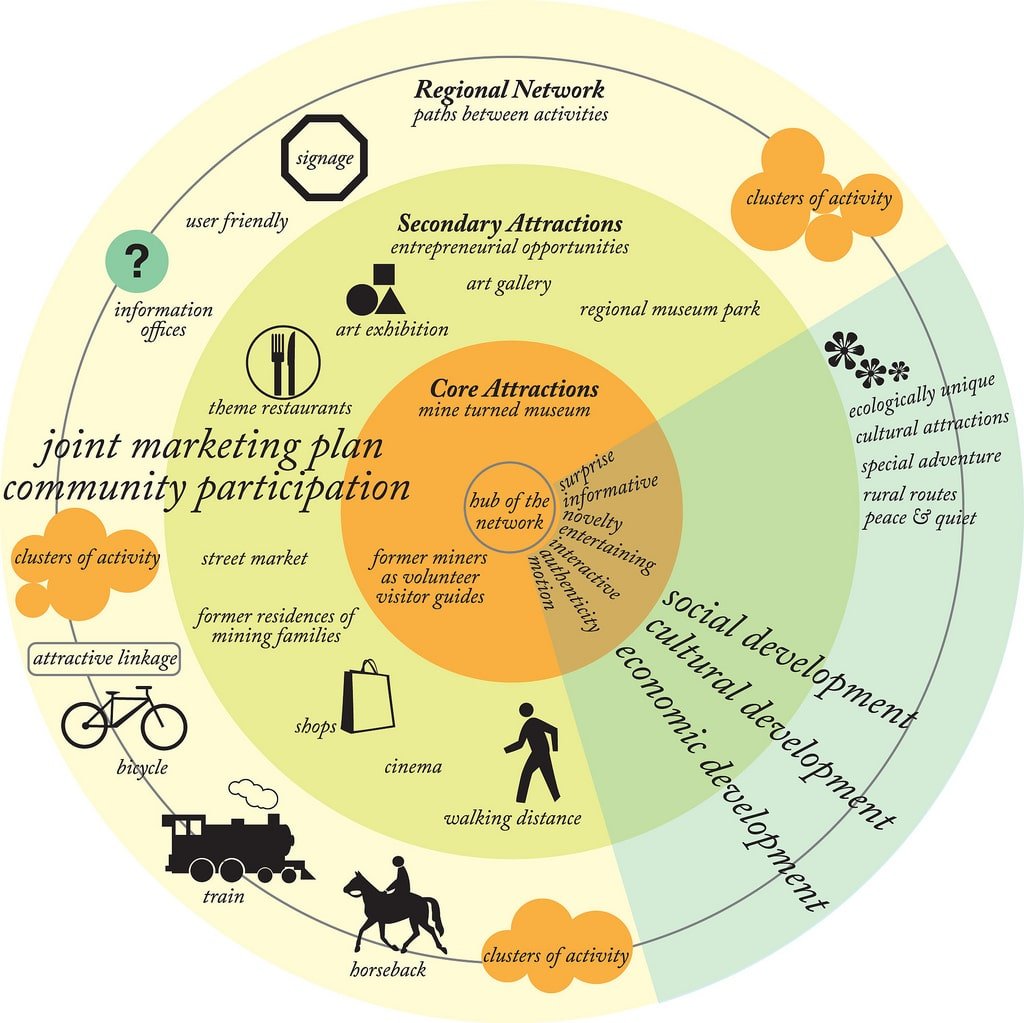
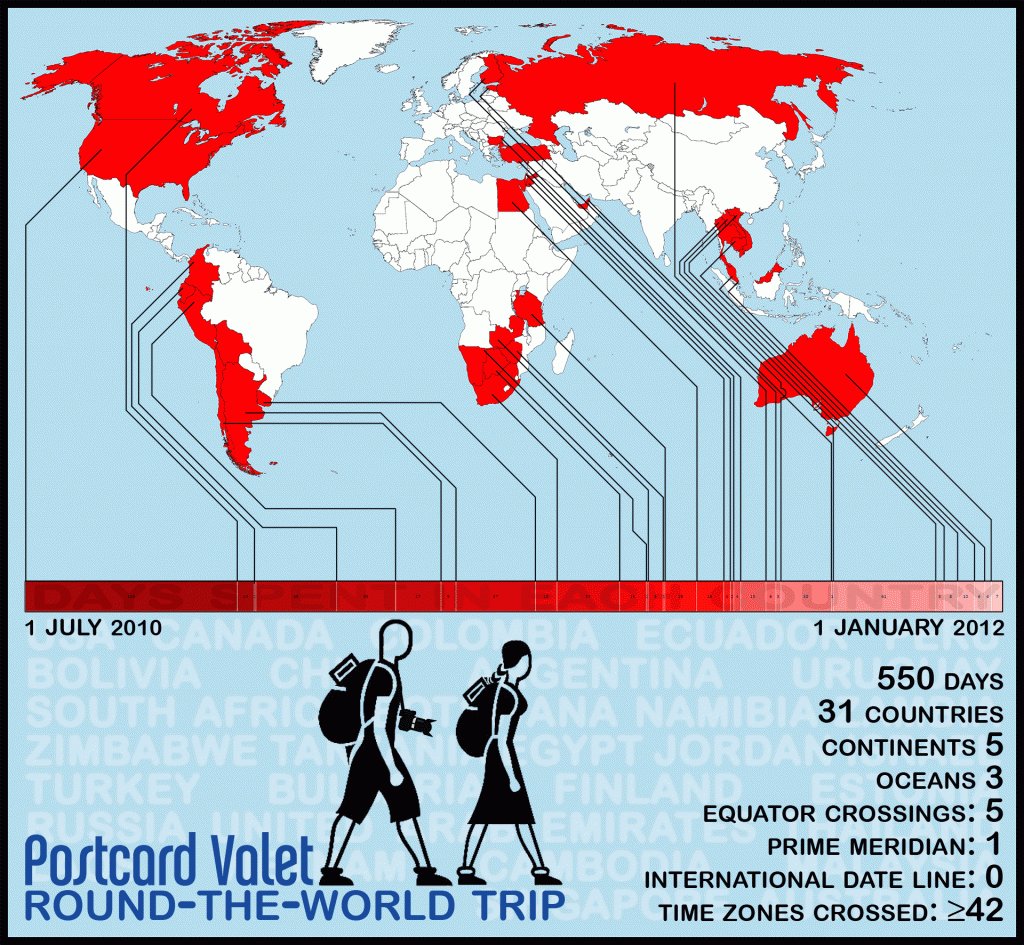
Here are a few great examples…
source: Kuoni
For more information about how Inceva Infographics can help your business tell its message please contact us today.


